Most operations managers we speak with know their 3PL invoice. They can quote carrier rates, pick-and-pack fees, and monthly storage costs without hesitation. What they have not calculated is the actual all-in cost of every order they dispatch: the damage claims, the returns sitting idle for two weeks, the freight surcharges on cartons that are the wrong size, and the margin disappearing on every order going to a customer in Perth from a single Melbourne warehouse.
The average eCommerce gross margin sits around 45%. Net margin, after fulfilment, marketing, and operational overhead, lands closer to 10%. That 35-point gap is where most of the real decisions get made. In 2026, a significant portion of it sits inside logistics choices that have not been reviewed in years.
This article covers what those decisions are, what the benchmarks look like, and where the biggest margin leaks tend to hide. It also covers what to do about them.
Why the Old Fulfilment Model Is Now a Liability
Most fulfilment models were built for a different cost environment. One where parcel rates were stable, marketplace fees were manageable, and the cost of acquiring a new customer was a fraction of what it is today.
That environment no longer exists. Australian storage rates increased 13% in a single quarter in 2025. Parcel surcharges have been layered on and normalised. Marketplace take rates have crept upward. Customer acquisition costs have moved in the same direction.
Every cost assumption baked into a fulfilment model designed before 2023 is now either outdated or working against margin. Businesses that have not revisited their logistics strategy in the last 18 months are operating with a structure that no longer reflects the reality of their P&L.
The structural issue is not carrier rates or warehouse fees in isolation. It is that fulfilment decisions, including where to hold stock, how to pack it, how to route it, and what delivery promise to make, have a compounding effect on margin that most businesses do not model until they are forced to.
What Should Fulfilment Cost? Benchmarks for Australian eCommerce Brands
The number most finance teams use as a reference is 8-15% of gross revenue for an efficiently run fulfilment operation. Businesses targeting 20% or more in net profit should keep fulfilment costs below 12% of revenue.
Most businesses do not actually know their number. They know what they pay their 3PL. They know their carrier invoice. But they have not calculated the full picture: damaged goods and claims, slow returns processing, storage fees on inventory sitting in the wrong state for three months, and the margin hit from offering free shipping on orders that do not generate enough contribution to cover it.
Fulfilment Cost Benchmarks by Business Type
| Business Type | Avg. Order Value (AOV) | Target Logistics Cost | Core Service Requirements |
|---|---|---|---|
| Fast-Fashion eCommerce | $40 – $70 | 14% – 18% of revenue | 1-2 days dispatch, high volume and returns handling capacity |
| Premium Homewares & Furniture | $150 – $400 | 10% – 12% of revenue | Oversized storage, careful handling, last-mile white glove options |
| B2B Wholesale & Retail Distribution | $500 – $2,000+ | 6% – 8% of revenue | Pallet-in, carton-out, strict compliance with major retailers (EDI) |
| Health, Cosmetics & Beauty | $60 – $120 | 12% – 15% of revenue | Batch tracking, expiry management, temperature-controlled options |
The AOV-to-Fulfilment Cost Ratio Most Finance Teams Overlook
A useful benchmark alongside the revenue percentage is the ratio between fulfilment cost and average order value. Fulfilment costs should not exceed 20% of AOV. For a brand selling products at a $50 AOV, that means keeping the all-in cost per order under $10. For a brand at $200 AOV, the same ratio allows up to $40 per order.
Understanding this ratio and building your fulfilment model around it is what margin-focused logistics actually looks like in practice. Scaling a business where fulfilment costs are already above 20% of AOV makes the problem worse, not better.
Critical Logistics Mistakes That Cost Margin
The most costly fulfilment expenses are often the ones that do not show up as a line item. They appear as customer service tickets, negative reviews, and customers who do not return.
Order inaccuracy is the most direct example. An industry-leading accuracy rate is 99.8% or above. At 99%, one in every 100 orders has an error. If you are dispatching 500 orders per week, that is five wrong orders every week. Each one costs you the replacement item, the return freight, the customer service time, and the probability that the customer does not order again.
Returns processing is another margin leak that most businesses underestimate. A return that takes 14 days to process is inventory that cannot be resold for 14 days. At scale, and for businesses with return rates above 10%, that idle inventory has a real impact on cash flow and margin recovery.
A premium homewares brand dispatching from a single Melbourne warehouse to a nationally distributed customer base is absorbing significantly higher per-order freight costs than a competitor using a national 3PL network. If 30% of their orders are going to Queensland and Western Australia, the shipping cost on those orders may be 40-60% higher than it needs to be.
That is not a shipping problem. It is an inventory positioning decision that is eroding margin on nearly a third of all revenue. The fix — repositioning stock to a Brisbane or Perth warehouse — does not require a product change, a pricing change, or a marketing campaign. It is a logistics decision that directly improves margin per order.
Three Fulfilment Decisions That Directly Move the Margin Line
Not all logistics improvements produce the same result. Some save a few cents per order. These three can shift margin meaningfully at scale.
1. Inventory Positioning Across Australian States
Storing inventory close to where your customers actually are is one of the most direct margin levers available. It reduces freight zone costs, shortens delivery windows, and, critically, allows you to offer reliable delivery promises without subsidising fast shipping.
Research consistently shows that reliability outranks speed alone for Australian shoppers. A clear, realistic delivery promise does more for conversion than an unsustainable fast-shipping offer that erodes margin on every order.
A national 3PL with facilities in Melbourne, Sydney, Brisbane, and Perth is not just operationally convenient. It is a margin decision. Every freight zone you remove from a significant portion of your order volume is margin recovered.
2. Packaging Optimisation and Dimensional Weight
Dynamic packaging, matching box or carton size precisely to the product, reduces both material costs and dimensional weight charges from carriers. Brands that audit their packaging regularly and adjust carton sizes can reduce carrier costs by 15-20% without changing anything about the product itself.
This is a one-time project that pays off on every order dispatched thereafter. For businesses at volume, it is one of the fastest-returning improvements available without renegotiating a single contract.
3. Returns Processing Speed as a Margin Lever
A returns process designed for speed, not just convenience, recovers margin faster. If returned goods are assessed, restocked, or redirected to secondary channels within 24 hours, you are not just improving customer experience. You are protecting inventory value and keeping the cash cycle moving.
A slow returns process is slow margin recovery. For businesses where product value is high, this is not a minor operational detail. It is a direct driver of how quickly capital is recovered from each return.
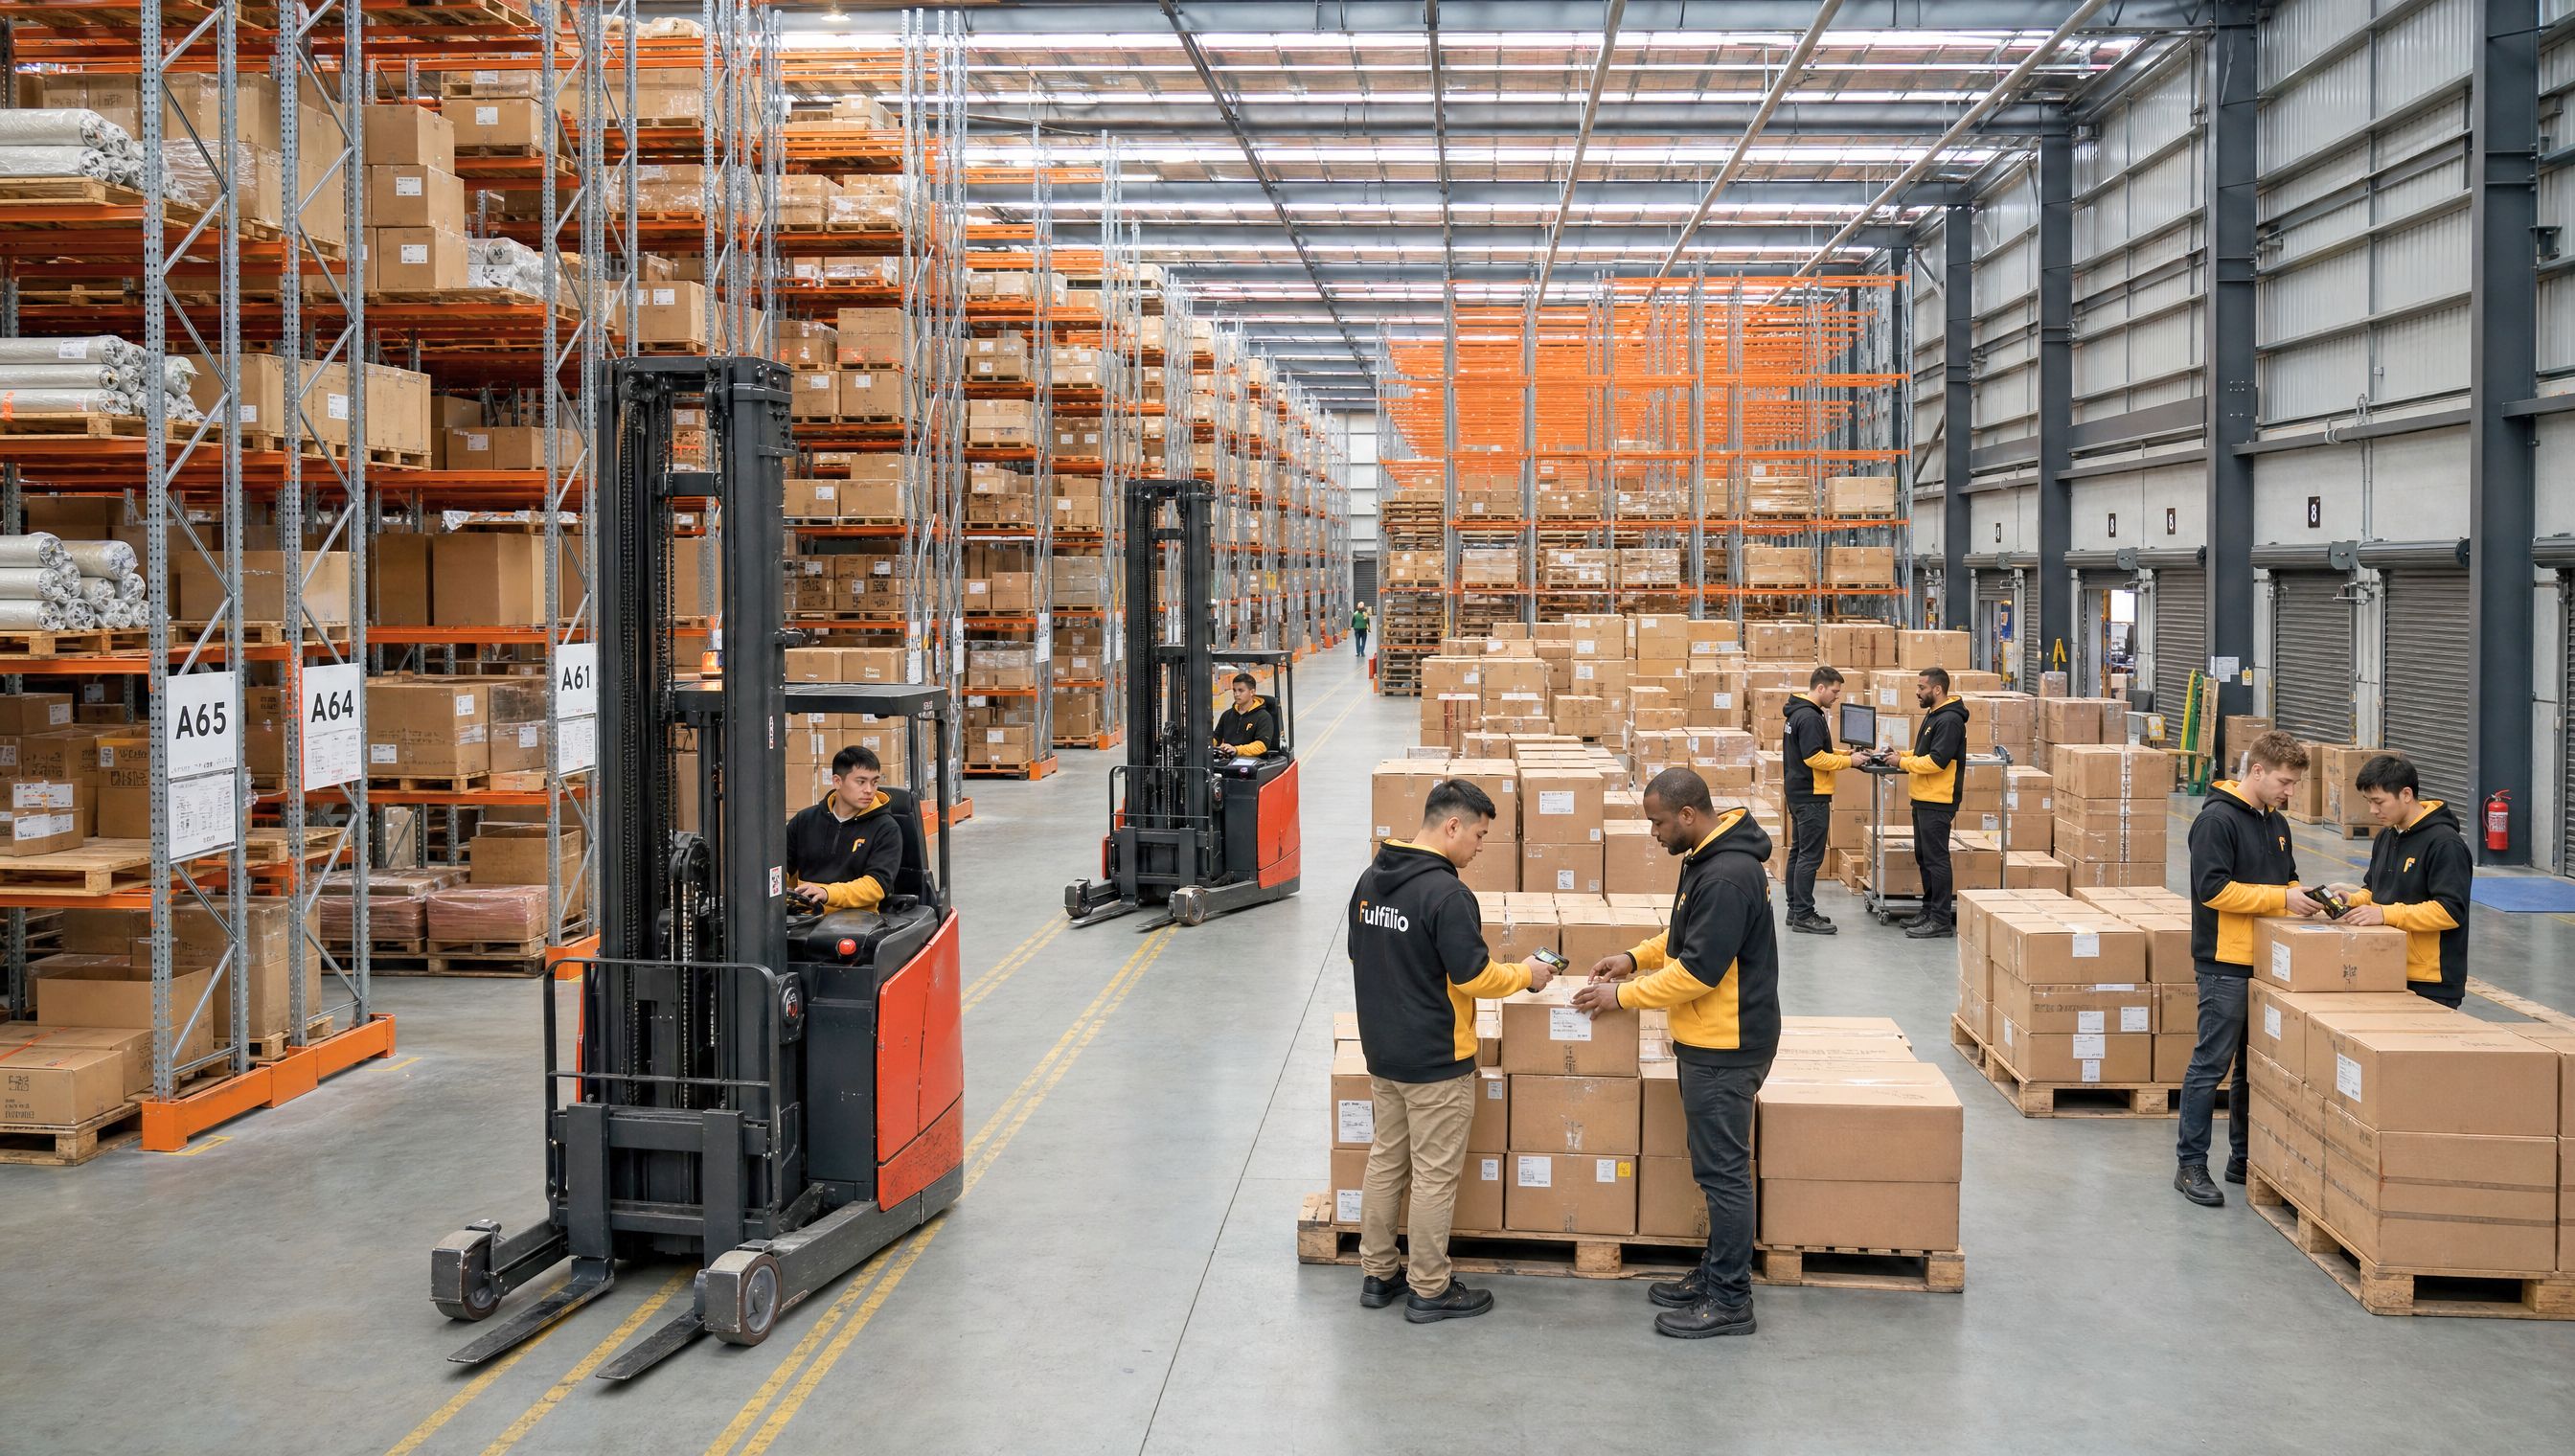
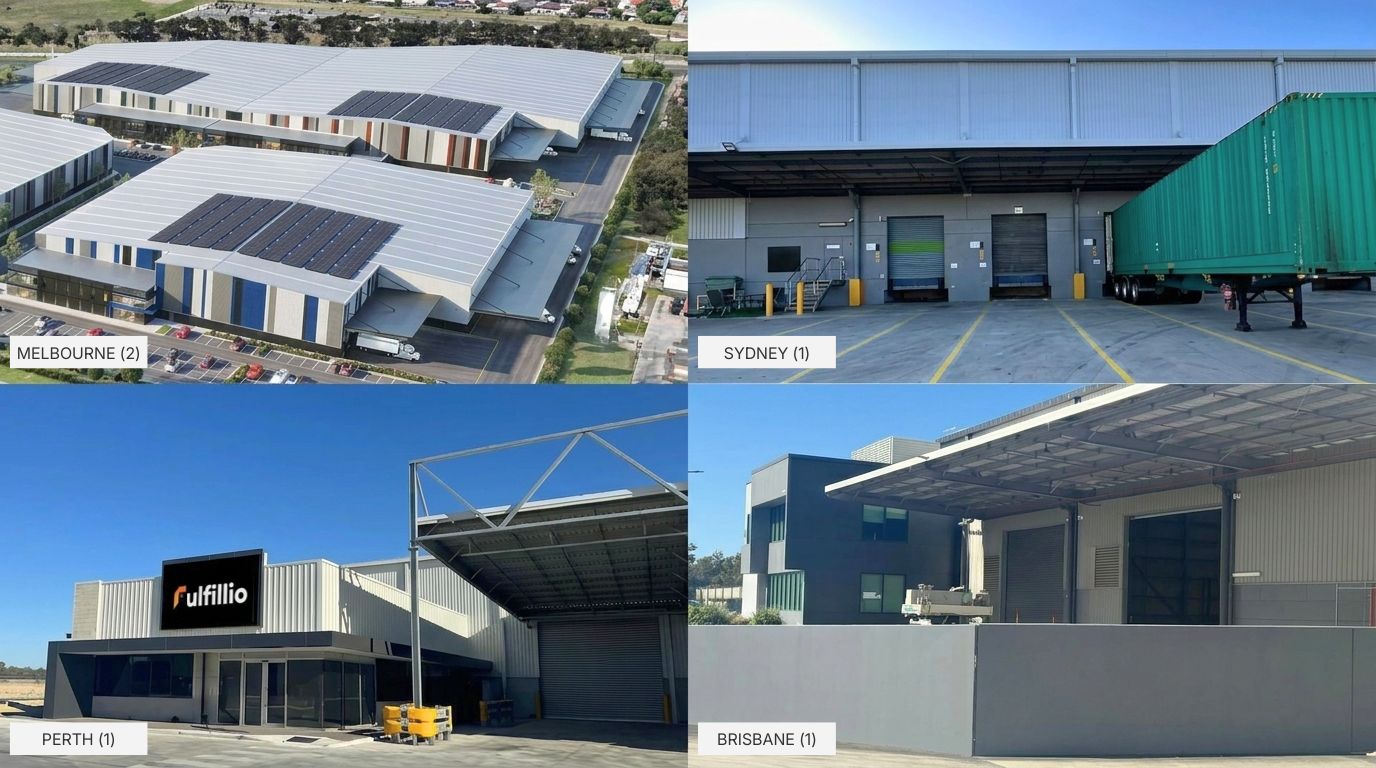
Fulfillio operates five distribution centres across Melbourne, Sydney, Brisbane, and Perth. Stock can be positioned closest to your actual customer base, reducing freight zones on your highest-volume delivery routes. Returns are processed within 24 hours across all sites. Order accuracy runs at 99.8% or above across 65,000 boxes dispatched monthly.
Sustainability Compliance Is Now a Financial Risk, Not Just a Brand One
There is a dimension that did not feature in logistics conversations five years ago: sustainability compliance.
Under Australia's mandatory sustainability reporting framework, the Australian Sustainability Reporting Standards (ASRS), large entities must now disclose their Scope 3 supply chain emissions, including those generated by their 3PL partner. Choosing a 3PL with no emissions data, no green infrastructure, and no carbon reporting does not just create a brand risk. It creates a compliance gap with direct financial and regulatory implications.
A logistics partner running solar-powered facilities, an electric or lithium fleet, and paperless operations across all sites actively reduces your disclosed Scope 3 footprint. That is a financial and compliance outcome, not just an environmental one.
For operations managers and finance teams thinking about 3PL selection in 2026, sustainability capability is increasingly part of the due diligence, not a nice-to-have.
Fulfillio's facilities operate with solar power. Warehouse operations run on fully electric machinery, including order pickers, forklifts, turret trucks and tuggers. Operations are paperless across all five sites.
How to Audit Your True Cost Per Order: A Practical Framework
Start with a number most businesses have not calculated: the actual all-in cost of a single order, including every cost that touches it from the moment inventory arrives at your warehouse to the moment the customer is satisfied or the product is returned and restocked.
The components to include:
- Receiving and storage costs (per unit, per week in warehouse)
- Pick, pack, and dispatch fees from your 3PL
- Carrier freight cost (actual average, not rate card)
- Packaging materials cost per order
- Damage and claims cost (total claims value divided by total orders)
- Returns processing cost (freight in, handling, restocking or write-off)
- Customer service cost attributed to fulfilment-related contacts
Once you have that number, set it against your AOV. If the ratio exceeds 20%, that is the starting point for your audit. If you cannot calculate the number at all, that is also the starting point.
Most businesses that run this exercise for the first time find the number is higher than expected, and find the biggest contributors are not the line items they were focused on.