In retail and eCommerce, inventory is often treated as an asset. It sits on the balance sheet, representing future revenue. The more inventory you hold, the safer you feel against stockouts and supply chain delays.
This perspective overlooks a critical financial trap: inventory carrying costs. Storing, insuring, and managing stock is expensive, and it drains working capital that could be used for marketing, product development, or expansion.
If your carrying costs are high, you are operating with a capital drag that limits your growth. This article explains what carrying costs are, how to calculate them, and how to optimize your operations to free up working capital.
Why Inventory Glut Is More Expensive Than It Looks on the Balance Sheet
Holding too much inventory (inventory glut) is a common response to supply chain uncertainty. Brands build buffer stock to prevent stockouts, especially during peak seasons or when dealing with international suppliers.
While buffer stock provides safety, it carries a high carrying cost. This is the capital trap: the cash tied up in excess inventory is cash you cannot spend on growing the business.
Excess stock is vulnerable to obsolescence, damage, and shrinkage. The longer a product sits in a warehouse, the less likely it is to be sold at full margin. In fashion, beauty, and food, shelf-life and trend cycles make this risk even greater.

The Four Real Costs Hidden Inside Your Inventory Number
Inventory carrying costs are typically estimated at 20-30% of the inventory value annually. This means holding $1,000,000 in stock costs $200,000 to $300,000 every year.
These costs are spread across four categories:
Inventory Carrying Cost Breakdown
| Cost Category | What It Includes | Annual Cost % |
|---|---|---|
| Capital Costs | Cost of purchasing inventory, interest paid on financing/loans | 10% – 15% of inventory value |
| Storage Space Costs | Warehouse rent, utilities, insurance, materials handling labor | 5% – 8% of inventory value |
| Service Costs | Insurance premiums, inventory taxes, inventory system overheads | 2% – 4% of inventory value |
| Risk Costs | Shrinkage (theft/damage), obsolescence, shelf-life write-offs | 3% – 5% of inventory value |
For a brand with $500,000 in average inventory, a 25% annual carrying cost equals $125,000 in expenses. If they can reduce inventory levels by 20% through better demand planning and faster replenishment cycles, they free up $100,000 in working capital and save $25,000 in carrying costs every year. That is cash that goes straight to the bottom line.
How to Calculate Your True Inventory Carrying Cost
To find your carrying cost percentage, use this formula:
Carrying Cost % = (Total Carrying Expenses / Total Inventory Value) x 100
Total carrying expenses should include storage space costs, service costs, risk costs, and the cost of capital (the interest rate on any financing used to buy stock, or the return you would get if that cash were invested elsewhere).
Once you have this percentage, multiply it by your average inventory value to find your annual carrying cost in dollars.

Three Operational Changes That Break the Capital Trap
Reducing carrying costs does not mean running out of stock. It means running a more efficient operation that turns inventory faster, using three key strategies:
1. SKU Rationalisation and ABC Classification
Classify your inventory using the ABC method. Focus your capital and attention on Class A SKUs (fast-moving, high-margin items) and reduce inventory levels of Class C SKUs (slow-moving items). If a product is not turning, liquidate it or bundle it to free up warehouse space and capital.
SKU Classification and Placement Strategy
| SKU Classification | Sales Contribution | Turnover Target | Optimized Placement | Action Plan |
|---|---|---|---|---|
| Class A (Fast-Moving) | 70% of revenue | 30 – 45 Days | Distributed nationally (closer to customer nodes) | Reorder automatically, monitor daily velocity |
| Class B (Medium-Moving) | 20% of revenue | 60 – 90 Days | Regional hubs (e.g. Melbourne/Sydney only) | Review velocity quarterly, adjust reorder points |
| Class C (Slow-Moving) | 10% of revenue | 120+ Days | Single central warehouse (reduce space fees) | Liquidate excess or bundle to free up warehouse space |
2. Faster Replenishment Cycles and Supplier Lead Time Audits
Instead of ordering large quantities of stock once or twice a year, move to smaller, more frequent replenishment cycles. This reduces the average inventory level in the warehouse, lowering storage fees and carrying costs. It also requires auditing supplier lead times to ensure replenishment is reliable.
3. Real-Time Demand Planning and Velocity Analysis
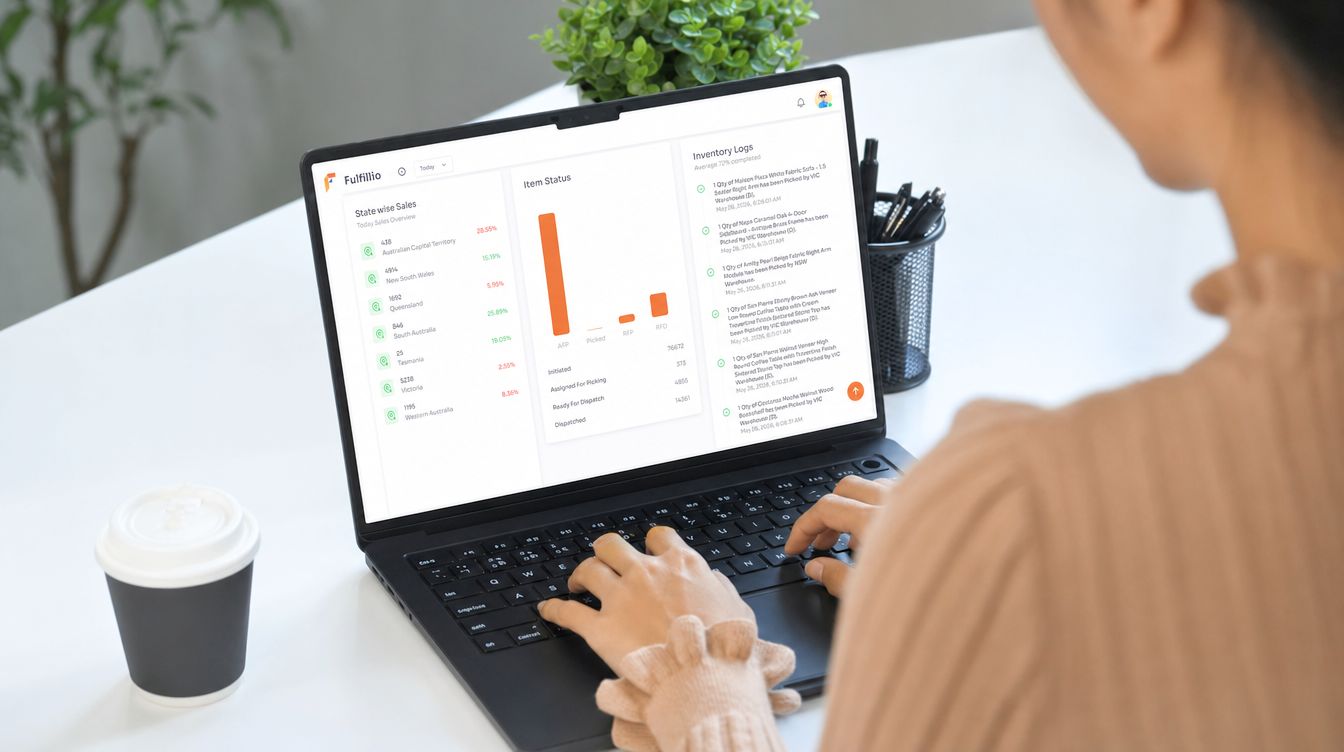
Use real-time sales data to forecast demand and adjust stock levels dynamically. A WMS that provides SKU-level velocity analysis allows you to spot trends early and adjust replenishment before excess stock builds up.
Fulfillio's client portal provides real-time sales and inventory data, including SKU velocity and turnover rates. This information helps you make data-driven decisions about reorder points, SKU rationalisation, and stock allocation, reducing excess inventory and carrying costs across all sites.